You close the books, send your client their financials, and three days later they ask why the revenue number doesn't match what they see in Stripe. The answer is that your dashboard reflects last month and their fintech tools reflect today. Accounting firms AI real-time client dashboards 2025 became the fix for that mismatch, and the firms adopting them are doing it because clients stopped accepting the lag. AI now handles the sync, categorization, and anomaly detection that used to require manual prep, which means dashboards can reflect current reality instead of a snapshot from two weeks ago.
TLDR:
AI-driven dashboards have moved well past static monthly snapshots. Where traditional reporting meant waiting until the books closed to see how the firm's clients were doing, the newer generation of accounting tools pulls live data continuously and surfaces what actually matters without requiring anyone to run a report.
The core shift is one of timing. A monthly report tells you what happened. An always-on dashboard tells you what is happening, which means a firm can catch a cash runway problem in week two instead of finding it at month-end.
The AI layer does more than pull numbers faster. It learns from transaction history, flags anomalies against expected patterns, and routes alerts to the right person before a small issue compounds. A few things this looks like in practice:
The difference for firms is less about the dashboard itself and more about what it changes downstream: fewer reactive conversations, more time spent on judgment-heavy work, and a faster feedback loop between what clients are doing and what their accountant knows about it.
Accounting firms spent years building client dashboards around static reports: month-end PDFs, quarterly summaries, spreadsheets pulled together by hand. That model worked when clients expected to wait. In 2026, they don't, especially as AI-native accounting software becomes the expected baseline.
Client expectations have shifted toward real-time visibility, and the firms keeping pace are the ones rebuilding their reporting infrastructure around AI. CPA.com's 2025 research on client expectations as standard service elements, not premium add-ons. The core change is not cosmetic. AI now handles the data ingestion, categorization, and anomaly flagging that used to require hours of manual prep before a dashboard could even reflect current numbers.
A few forces are driving this shift together:
The result is that real-time client dashboards have become a retention and differentiation tool; a reporting convenience doesn't cut it anymore. Firms rebuilding around AI are doing it because the alternative is losing clients to solutions that already offer this by default.
AI has added four concrete capabilities to client-facing dashboards that accounting firms simply could not offer before.

| Capability | What It Does | Concrete Benefit |
|---|---|---|
| Continuous data sync | Pulls from connected accounts in real time instead of monthly snapshots | Clients see financial position as of today, not 30 days ago |
| Automated anomaly detection | Flags unusual transactions, expense spikes, or cash patterns that deviate from historical norms | Issues surface before the client notices anything is wrong |
| Predictive cash flow modeling | Projects forward-looking runway and burn using historical patterns and upcoming obligations | Visibility that used to require a dedicated analyst |
| Plain-language summaries | Generates written interpretation of the numbers automatically from underlying data | Clients understand what financials mean for their business this week instead of seeing raw ledger data |
The next wave of AI in client dashboards goes beyond surfacing data: it acts on it. Agentic AI takes multi-step actions autonomously, pulling updated figures, flagging anomalies, drafting advisory notes, and queuing alerts for accountant review, all without waiting for a human to initiate the workflow.
For accounting firms, this changes the role of a client dashboard from a read-only report into something closer to a live workflow layer. Instead of an accountant logging in to check whether a client's burn rate crossed a threshold, the system flags it, drafts a summary, and routes it for review.
A few ways agentic behavior is showing up in practice:
The accountant stays in control at every step. Agentic AI prepares the work; the firm approves and delivers it. That distinction matters, because the value firms provide is judgment, not data retrieval.
Real-time data is the baseline, not the differentiator. A dashboard that refreshes every few seconds but surfaces the wrong information still wastes your client's time and yours.
The accounting firms getting the most out of AI-driven dashboards today are building around three qualities that go beyond speed:
Dashboards that skip these qualities create a different problem: clients who either disengage because the data feels noisy, or over-rely on numbers they misread. Neither outcome serves the firm's advisory relationship.
The real measure of a useful dashboard is whether it reduces the number of clarifying conversations between a firm and its clients, while making the ones that do happen more substantive.
Accounting firms running monthly close cycles carry a built-in lag. By the time client books are closed, categorized, and reviewed, the financial picture you're presenting is already weeks old. AI is shrinking that window fast.
McKinsey research on AI in finance teams found that AI-assisted finance teams cut close cycle times by up to 40%. For accounting firms, that compression has a direct effect on dashboard freshness: when the close finishes faster, clients see accurate data sooner, and the dashboard stops being a historical artifact and starts reflecting reality.
The month-end close is the chokepoint. Until it clears, dashboards are built on incomplete or unreconciled data.
The result is that client-facing dashboards reflect a financial state that is days, not weeks, behind the present. For startups tracking burn rate and runway, that gap matters.
Accounting firms running on disconnected data sources face a quiet but costly problem: by the time client financials make it into a dashboard, the numbers are already stale. Transactions pulled from bank feeds, invoices sitting in one system, payroll in another, and expense reports somewhere else entirely create a patchwork that no AI can interpret accurately without first stitching it all together.
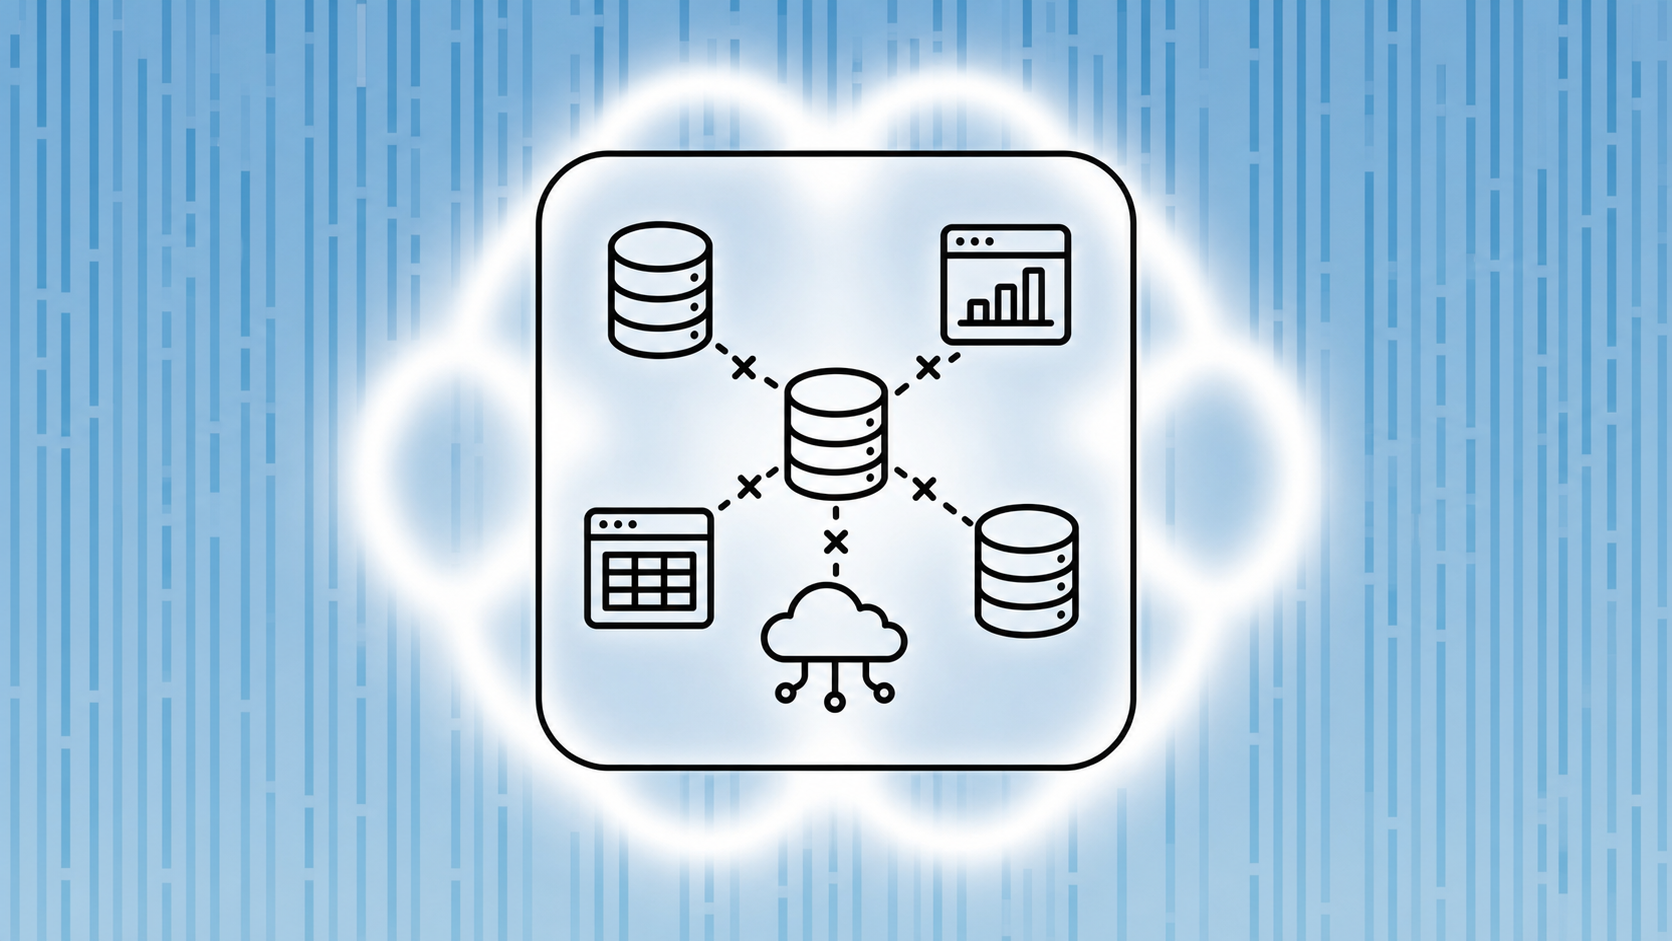
This is where most real-time dashboard attempts fall apart. The AI layer gets blamed, but the actual failure is upstream, at the data integration level.
Firms running AI dashboards today consistently run into the same structural gaps:
Firms that have solved this problem share one trait: their AI works directly on a continuously updated, unified ledger, not on a downstream copy of it.
Puzzle was built AI-native from day one, which means real-time financial visibility isn't a feature added on top of legacy architecture. It's how the whole system works.
For accounting firms managing startup clients, that distinction matters. Puzzle connects directly to the fintech tools founders already use (Stripe, Mercury, Ramp, Brex, Gusto) and keeps the books updated continuously. Client financials stay current without waiting for a manual sync or a month-end close to see where things stand.
The AI handles categorizes 85–90% of transactions automatically without human input. Accountants review and approve before anything is finalized, so the firm stays in control of what hits the books. That review layer is the difference between AI as a shortcut and AI as a reliable part of a firm's workflow.
For firm clients, that means burn rate, runway, and ARR are visible in real time, not reconstructed after the fact. Firms can spot issues early and advise proactively instead of reacting after a client's already in trouble.
Real-time dashboards built on AI-native infrastructure let accounting firms catch problems in week two instead of finding them at month-end. That shift from backward-looking reports to forward-looking alerts changes the entire advisory relationship. If you want to see how continuous data sync and automated categorization work without the usual integration breakdown, book a demo. The firms that rebuilt around this model did it because their clients stopped accepting three-week delays between transaction and insight.
Yes. AI-native dashboards handle continuous data sync, categorization, and anomaly flagging automatically, but accountants review and approve everything before it reaches client books. The AI prepares the work; the firm delivers the judgment and advisory expertise clients pay for.
Real-time dashboards pull updated data continuously so clients see current numbers instead of month-old snapshots. Agentic AI dashboards go further by taking autonomous multi-step actions: flagging anomalies with context, drafting advisory notes, and queuing alerts for accountant review, all without waiting for manual triggers each time.
Month-end close is the bottleneck that keeps dashboards showing incomplete data. AI auto-categorization and continuous reconciliation cut close cycles by up to 40%, which means client-facing dashboards reflect financials that are days behind the present instead of weeks. For startups tracking burn and runway, that timing gap matters.
Dashboards break when they pull from disconnected sources: bank feeds in one system, payroll in another, expenses somewhere else. Batch syncing instead of live feeds, siloed apps with fragile API connections, and schema mismatches on import all create data fragments that no AI can interpret accurately without a unified, continuously updated ledger.
Three qualities: contextual alerts that flag what actually needs attention (number changes that matter), role-appropriate views so founders see runway while firms see reconciliation queues, and explainability at every data point so clients understand why numbers changed without filing support tickets. Real-time is the baseline; reducing noise while surfacing insight is what makes dashboards worth opening.