Startup Accounting
Complete Founders' Guide to Burn Rate and Runway in 2026
Updated 2026: Master burn rate and runway with our founders' guide. Learn to calculate net burn, project runway, and track cash flow for your startup on Puzzle.

8.16.22

Updated 2026: Master burn rate and runway with our founders' guide. Learn to calculate net burn, project runway, and track cash flow for your startup on Puzzle.
Pulling ARR from your CRM, burn from your bank accounts, and runway from a spreadsheet is slow, and one missed transaction or stale export can throw off every number you report to investors. Purpose-built tools, including Puzzle, pull these metrics together automatically, so you are not reconciling three sources by hand every month. This guide covers how burn, runway, and burn multiple are defined, how tools like Puzzle automate the dashboard that tracks them in real time, and what to look for when you choose a tool to manage your startup's cash position.
TLDR:
Most broadly, “burn” (also referred to as “burn rate”) is the amount by which cash spent exceeds cash received for a given period. This scenario is very common, especially for early-stage startups with high growth potential. Developing a product, proving product-market fit, and identifying an appropriate business model all require investments of time and money, often outpacing the ability to generate revenue. Here's how to calculate burn rate for your startup.
While burn and runway are terms that are used similarly across the fintech, saas, and venture capital world, there can be variations in the details of terminology and calculation methods.
Within this post, we distinguish and identify commonly-used terminology and explain Puzzle’s specific method of calculating each metric, including how we intend for our calculation method and naming convention to be as intuitive and useful as possible.
Puzzle is a Series A company based in San Francisco, California, that combines automation, machine learning, and real-time data to generate financial statements and insights in minutes.
Net burn is a company’s net cash activity for a period.
Net burn is sometimes referred to simply as “burn” since this is the most commonly used version of burn. Burn is frequently calculated for a single month, though calculating average burn for a certain period (e.g. average of burn from the most recent 3 complete months) is common too, in order to smooth out irregularities in cash activity from month to month. Burn includes all the cash in minus all of the cash out during the period, with the exception of non-operating cash activity such as new equity investments or debt financing.
The term “net burn” is commonly used to distinguish from “gross burn,” which refers to the total of all cash spent on operations without including any cash received (e.g. from customer revenue). In Puzzle, gross burn is referred to as “Cash Out” and is included in the Cash Activity Report.
In Puzzle, Cash Out includes both “Cash Out from Operations” and “Other Cash Out,” which includes any non-operating cash activity such as taxes and interest while excluding cash activity related to equity or debt.**
Bank burn is the change in bank account balances between the beginning and end of a period.
This is the simplest version of burn to calculate. It is useful for understanding changes but can be misleading for calculating runway if there are cash activities for financing such as cash received from outside investors, lenders, or employees for options exercises.
💡
What if my company is cash flow positive? Do we have positive burn?
Even though it’s common for companies to have negative cash flows as startups (yes, entrepreneurship is hard), the sector where the term “burn” is most frequently used, some entrepreneurs are able to generate positive cash flows or bootstrap the company using customer revenue to fund growth.
If you have net positive cash flow (great news, you are default alive!), this would typically not be referred to as “burn.” The most common use of “burn” is that it represents net negative cash flow; as the name suggests, it’s supposed to represent how quickly invested money is being depleted.
At Puzzle, we call net positive cash flow “cash generated” instead of “burn” or “negative burn,” in order to reduce the potential for confusion.
Burn multiple is how much a startup is spending, on average, to generate incremental ARR for a given period.
Burn multiple is calculated as annualized net burn (for a period of less than 12 months) or annual net burn (for a period of 12 months) divided by net new ARR during that same time period. Net new ARR is equal to New ARR + Expansion ARR - Churned ARR - Contracted ARR. A burn multiple can also be calculated with monthly net burn and MRR.
Since burn multiple captures the ratio of how much cash is being depleted to revenue growth, burn multiple is an indicator of how well a company is growing. Investors and shareholders will expect this numbers to be as low as possible (below 2.0 or, even better, below 1.0).
Calculating burn multiple requires accurate ARR data from your billing system or CRM, pulled alongside your burn figures, which makes it nearly impossible to track without a tool that brings both ARR and burn into the same view. Investor benchmarks for this metric (popularized by David Sacks) generally fall into tiers: below 1.0 is excellent, between 1.0 and 2.0 is good and signals capital-efficient growth, between 2.0 and 3.0 is acceptable for an early-stage company, and above 3.0 tends to draw investor scrutiny. For example, if your startup burned $300,000 in a quarter and added $200,000 in net new ARR, your burn multiple is 1.5x, considered capital-efficient.
Net burn is often used as the basis for calculating runway, making decisions about extending runway (i.e. by reducing net burn), and deciding when to start fundraising.
Runway is the length of time (typically described in months) before a company projects thatit will run out of cash.
Runway end date (also called “cash out date” or “zero cash date”) is the projected date a company will run out of cash, based on a projected runway or cash forecast.
Runway end date determines runway coverage month, which is the last full month that the cash would cover based on the burn run rate (i.e. the month prior to the runway end date).
In its simplest form, your runway can be calculated as current cash divided by the current net burn rate (monthly). This length of time (in months) is added to the current date to get the runway end date.
Run rates are representations of activity over a period of time, often used to represent the current baseline rate for what to expect going forward.
Run rates can also refer to extrapolations of activity over a longer time period. An “annualized run rate,” for example, does not represent what has happened over the past year; it represents what will happen over the next year if everything continues at the same rate as a recent period (typically a month or 3 months).
For example, if a company spent $150,000 last month with $50,000 of cash coming in from recurring customer revenue ($100,000 monthly burn), it can be described as having a $1.2 million “annual burn run rate” and $600,000 “annual revenue run rate.”
To normalize burn when cash flows are inconsistent from month to month, burn is frequently described based on averages from the past 3, 6, or 12 months (and is often written as T3M, T6M, or T12M/TTM burn rate). These normalized averages may be used instead of monthly burn for run rate calculations.
Tools like Puzzle make it easy to identify which spending categories are driving the most burn, so founders can make targeted cuts.
When determining runway, it is important to remember that while the formula for runway (can be a good approximation if the future will be similar to the current run rate, it is a simplified version of runway and is often just a rough proxy. When companies want to develop more accurate runway forecasts that reflect future hiring and expected changes in revenue and expenses that are different than the current net burn, they develop more sophisticated financial models that predict future cash activity month-by-month.
Manually reconciling ARR from your CRM, burn from your bank accounts, and runway from a spreadsheet leaves room for error and delay. The tools below connect all three data sources in a single view, so founders can track the metrics that matter without stitching numbers together manually.
| Tool | Tracks ARR | Tracks Burn | Tracks Runway | Real-time bank sync | Best for |
|---|---|---|---|---|---|
| Puzzle | Yes | Yes | Yes | Yes | Founders who want accounting + burn/runway in one place |
| Parallel | Yes (via accounting integration) | Yes | Yes | Yes | Founders who want scenario modeling on top of live actuals |
| Finmark by BILL | Yes | Yes | Yes | Partial | Solo founders needing quick cash-out date visibility |
| Float | Limited | Yes | Yes | Yes | Early teams focused on short-term cash visibility |
| Retool | Custom | Custom | Custom | Custom | Teams that want a fully custom-built financial dashboard |
ARR tracking depth varies by tool and integration setup.
Accounting-native tools like Puzzle connect directly to your financial data sources in real time. Puzzle tracks burn (via the Cash Activity Report), runway (via the Available Cash Balance metric), and burn multiple, with integrations for Stripe, Brex, Mercury, and Ramp keeping all three metrics current as transactions clear. Best for founders who want accounting plus burn/runway in one place.
For a broader look at AI agents built for startup finance, see our roundup of the best AI finance agents.
Standalone FP&A and runway tools like Finmark by BILL and Float focus on cash forecasting and scenario planning. Finmark offers easy onboarding, runway dashboards, and fundraising scenario modeling. Float focuses on short-term cash-flow forecasting and runway charts with fast setup. Both track burn and runway well but require a separate accounting system for full financial reporting.
Custom dashboard builders like Retool let engineering-resourced teams build a fully custom financial runway dashboard by connecting to their own data sources via APIs. Best for teams that need a view beyond what off-the-shelf tools offer.
The next section covers how Puzzle implements this unified view, including its Cash Activity Report and Available Cash Balance metric.
Puzzle team members have created a set of tools for startup founders to calculate and confidently understand the components of burn quickly. Since burn and runway are not in financial statements, we reduce the headache of pulling together various sources into spreadsheets by showing the components of burn in a single view. ARR typically lives in billing systems like Stripe or Chargebee, while burn lives in your bank accounts, and runway often ends up calculated by hand in a spreadsheet. Puzzle connects these sources by integrating with your financial data, so burn and runway stay current without manual updates. The burn multiple metric shown in Puzzle requires pairing burn data with net new ARR, and Puzzle's integrations are built to support this combined view across both figures.
At the top of the Puzzle Dashboard are cards that display key recent metrics.
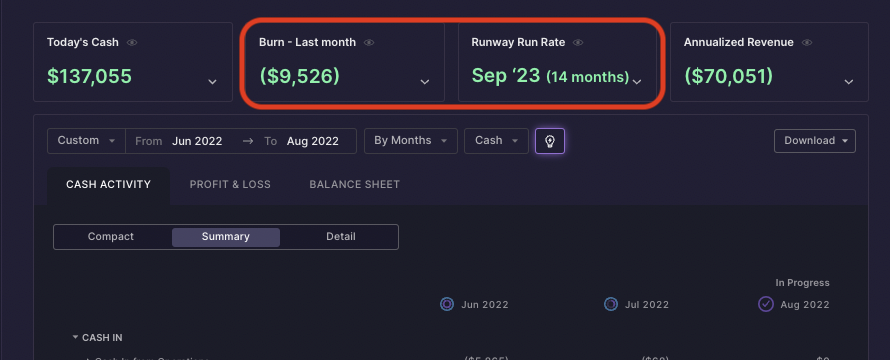
The Burn card shows net burn in the default view with bank burn as an option in the expanded view. For both types of burn, you can toggle between the previous month burn and the 3 month average burn.
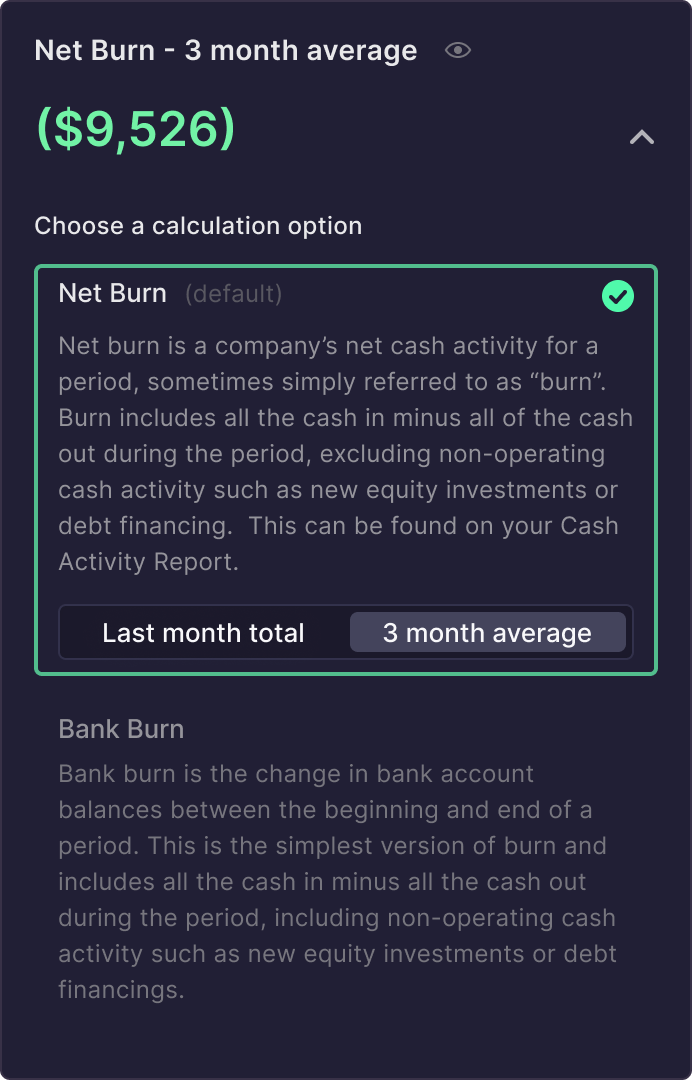
In the Cash Activity Report (see below for details), you can view the details of the last month burn (for the example above, $9,526 of burn) by categories, vendors, and even individual transactions.
The Runway card displays 1) the projected last month your current Available Cash Balance, which includes the most recent information as of the day you are viewing the card, will be able to fully cover expenses and 2) the projected number of months your current Available Cash Balance will fully cover your expenses. The calculation is based on monthly burn run rate for the most recent full month.
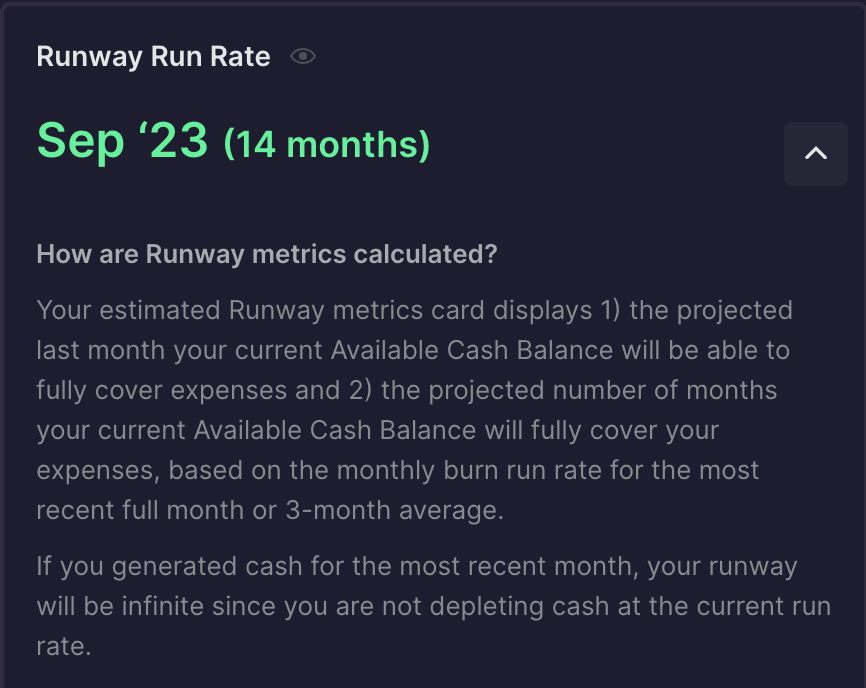
💡 A detailed explanation for anyone curious about how we calculate runway end date at Puzzle…. Your runway and runway coverage month in Puzzle are based on fractional months covered by your burn. The best way to show this through an example:
If you have $180,000 as your Available Cash Balance as of 4/10/2022, and your burn rate is $24,000 per month from the previous month, your runway is 7.5 months [$180,000 / $24,000].
Your runway coverage month is November 2022 [currently at month 4.33 (since you are 1/3 through April 2022) + 7.5 months, rounded down since this would not cover 100% of December at the current projected burn rate].
If, instead, the date were 4/20/2022 [represented as 4.67], then your runway coverage month would be December 2022, since the current cash balance would cover the entirety of December based on that projection.
Within Puzzle, we use fractional months (instead of a day-based burn and runway) because the most common recurring business costs (including rent, hosting costs, subscriptions, and payroll) are typically monthly (instead of daily) amounts. Except in a few edge cases, daily and monthly changes will give the same outcome, and it may be sensible to use a daily calculation if you have more day-based costs, but we want to be transparent about how we calculate it and why!
Burn is a key metric for startups but cannot be analyzed in traditional accounting statements. For this reason, Puzzle created the Cash Activity Report.
Unlike a typical Statement of Cash Flows, which either shows changes in balance sheet accounts (unintuitive) or general categories of cash expenditure (too broad), the Puzzle Cash Activity Report allows exploration of the composition of burn and cash balance. You can view burn at different levels of analysis, from high-level summary to vendor-level detail. You can also click into any amount to view the individual transactions that make up that total and view the details of the transaction.
The Puzzle Cash Activity report treats credit card spending as equivalent to spending cash in the “Cash Out” bucket. As a result, credit card spending is included in the burn calculation. Since many companies use credit cards for subscriptions, work-related employee spending, and other purchases, including credit card spending better represents burn, compared to waiting to include those amounts in burn until the credit card payment is made.
Waiting to include credit card amounts in burn until the eventual credit card payments have been made can lead to misleading, non-real-time calculations of runway by implying you have cash to spend for future months that will actually go towards credit card payments, and (possibly) that your burn rate is lower than it is.
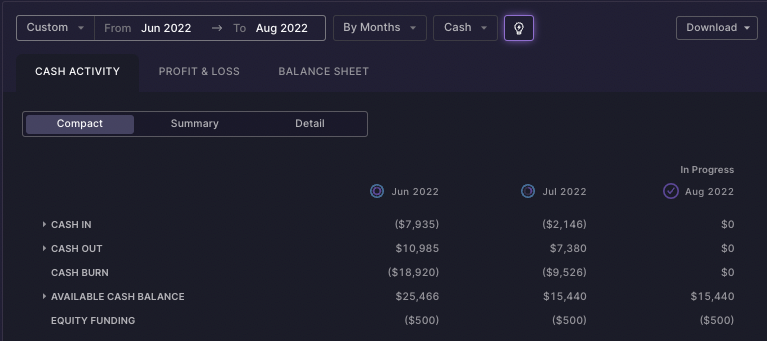
You will notice that the July cash burn number of ($9,526) in the Cash Activity Report is the same as in the burn card displayed above. The Cash Activity Report is where you can see the detail of that burn number!
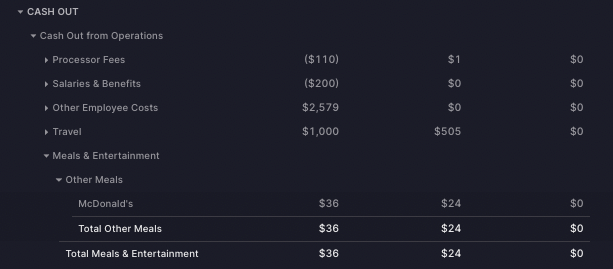
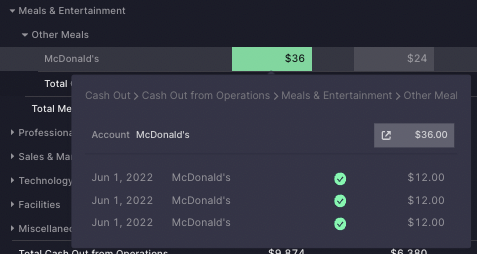
Since your Puzzle account is connected to banks, credit cards, and payment processors, automated bank reconciliation records transactions in real-time as the event happens. Using information from the APIs of those financial systems, Puzzle then applies auto-suggested categories and vendors to these transactions. Your Cash Activity Report stays updated with the most recent transactions as they arrive, aligned with your roadmap.
To calculate your burn and runway in the most useful way possible, Puzzle uses automation and a metric we call “Available Cash Balance,” which totals all your current bank balances but then subtracts any credit card balances and amounts owed to employees for payroll for the most recent period that has not yet been paid.
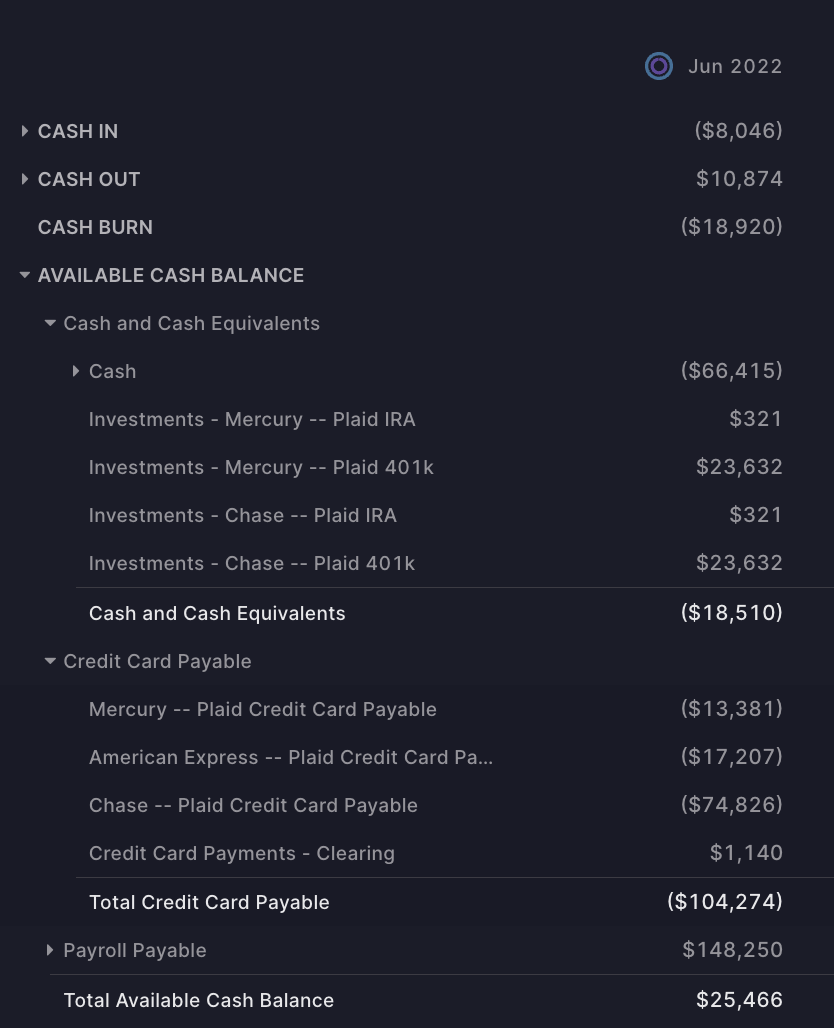
As mentioned in the “Cash Activity Report” section, we treat credit card purchases and amounts owed to employees as if the cash has already been spent. It is removed from the Available Cash Balance since it is no longer available for spending. As a result, it is no longer considered in the cash amount used to calculate the remaining runway.
Are you a first-time founder, cofounder, or CFO, and have suggestions about improving and ideas for a new product? Contact us at support@puzzle.io, tweet, or follow us on Linkedin.
We offer concierge onboarding if you’d like to set up your books accurately from day one without a finance team. We’re here to empower you to do your bookkeeping and understand your finances in the early days and as you scale: building the workflows, features, and ecosystem you need to thrive!
AI agents can now pull live bank, card, and ARR data to answer burn and runway questions in plain language, which cuts down on the manual exports founders used to run before every board meeting. Instead of pulling a CSV from your bank, another from your CRM, and building a formula in a spreadsheet, you can ask a question and get a current answer built on data that updated this morning.
Tools like Puzzle expose an MCP and API layer so AI agents can query your burn rate, runway, and cash balance directly, rather than working from a static export that goes stale within days. This connection is what lets an AI assistant answer with your actual numbers instead of a guess.
As a result, more founders are typing questions like "What is my current burn rate?" into an AI assistant and getting a real-time answer backed by live accounting data, with no spreadsheet reconciliation required first.
Net burn is your net cash activity from operations for a period (cash in minus cash out, excluding financing activities), while bank burn is simply the change in your bank account balances between two dates. Net burn gives a clearer picture of operating cash flow, while bank burn can be misleading if you've received investor funding or loan proceeds during that period.
Puzzle uses your Available Cash Balance (bank balance minus credit card balances and unpaid payroll) divided by your monthly burn rate to calculate your startup runway. Credit card spending is counted as spent immediately instead of waiting for payment, giving you a more accurate real-time view of how many months you can operate before running out of cash.
Investors typically expect a burn multiple below 2.0, with below 1.0 being ideal. This metric shows how much you're spending to generate each dollar of new ARR (calculated as annual net burn divided by net new ARR). A lower number means you're growing more cash-efficiently.
Puzzle connects to your bank and credit card APIs directly, so burn rate, Available Cash Balance, and runway update automatically as transactions clear. No manual exports or spreadsheet assembly required.
Real-time burn tracking tells you when to hire, when to cut spending, and when to start a fundraise. Monitoring it monthly means you catch a spending spike in the month it happens, not six weeks later, and you can walk into investor conversations with current numbers.
A 3-month average smooths out irregular monthly expenses like annual software renewals or quarterly tax payments, giving you a more stable baseline. Use last month's burn if your spending pattern is consistent, but switch to a 3-month average if you see notable month-to-month variation in cash flow.
Most investors recommend opening fundraise conversations when you have nine to 12 months of runway left, because a raise typically takes three to six months to close. Starting early keeps you in a stronger position at the negotiating table. Real-time runway tracking in a tool like Puzzle lets you set a clear trigger: when your runway drops to your target threshold, it is time to reach out.
The Cash Activity Report tracks actual cash movement (when money leaves your account), while your income statement uses accrual accounting (when expenses are incurred). Credit card purchases appear immediately in your Cash Activity Report but may show in different periods on your income statement depending on when they're recognized.